So I’m a nerd, I love really fast cars, and have high standards. Bad combination when you’re staring at some GoPro footage going “meh…” Ever since getting the Fraser I’ve been on a mission to make the best possible onboard footage, I think I’m getting close…
So the above (you’ve played it right?) is the latest iteration of my videos and it’s pretty close to what I want in an Onboard video. So how do you make a video like the above? Take one RaceCapture Pro by Autosport Labs; the ubiquitous GoPro, and DashWare. Throw them all together, and voila ! Onboard car p-rn. Okay well it’s not quite that easy.
Step 1 – Telemetry: RaceCapture Pro
In order to get all data (RPM, Speed etc) you need to capture it and log it. There’s three different types of information you might be interested in – ECU based information, what the engine is reporting. Positional information – where you are, what the car is doing in terms of acceleration and speed, and finally auxillary information such as steering wheel angle or brake pressure. Most phone based apps start at the basics of in-accurate GPS information, adding an external GPS they get quite a lot better, but then you want to get the ECU information, that’s where things get tricky…
Previously I was using RaceChrono with a Garmin Glo GPS with good success, however to get the ECU based information I needed an OBDII port – I was out of luck as in my case the LINK Storm G4+ ECU had one CAN connector, which already had a baud rate of 1mb/s setup for my AIM MXL dash, splicing in an OBDII port was not an option as the the OBDII protocols don’t like a baud rate of 1mb/s. Hunting around I came across the RaceCapture Pro which is a dedicated datalogger/telemetry system. Here’s some of the key features :
- CAN integration – Pull anything output on the CAN Bus
- External GPS – Fast, accurate, external GPS antenna (down to 2.5m CEP @ upto 50hz!)
- Auxiliary Sensors – So I can add a brake pressure sensor in future.
- Onboard logging – logs to an SD card, no futzing around with phones if you don’t want.
- Configurable cross devices – Using your Mac/PC/Android you can configure it
- Real time display – With an Android device and bluetooth module get real time info !
- Open source – My IT nerd self loves this…
-
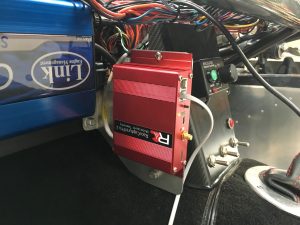
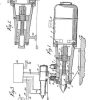
- RaceCapture Pro installation

-
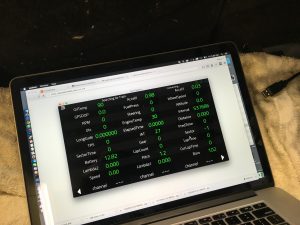
- Real time read out from the RaceCapture Pro

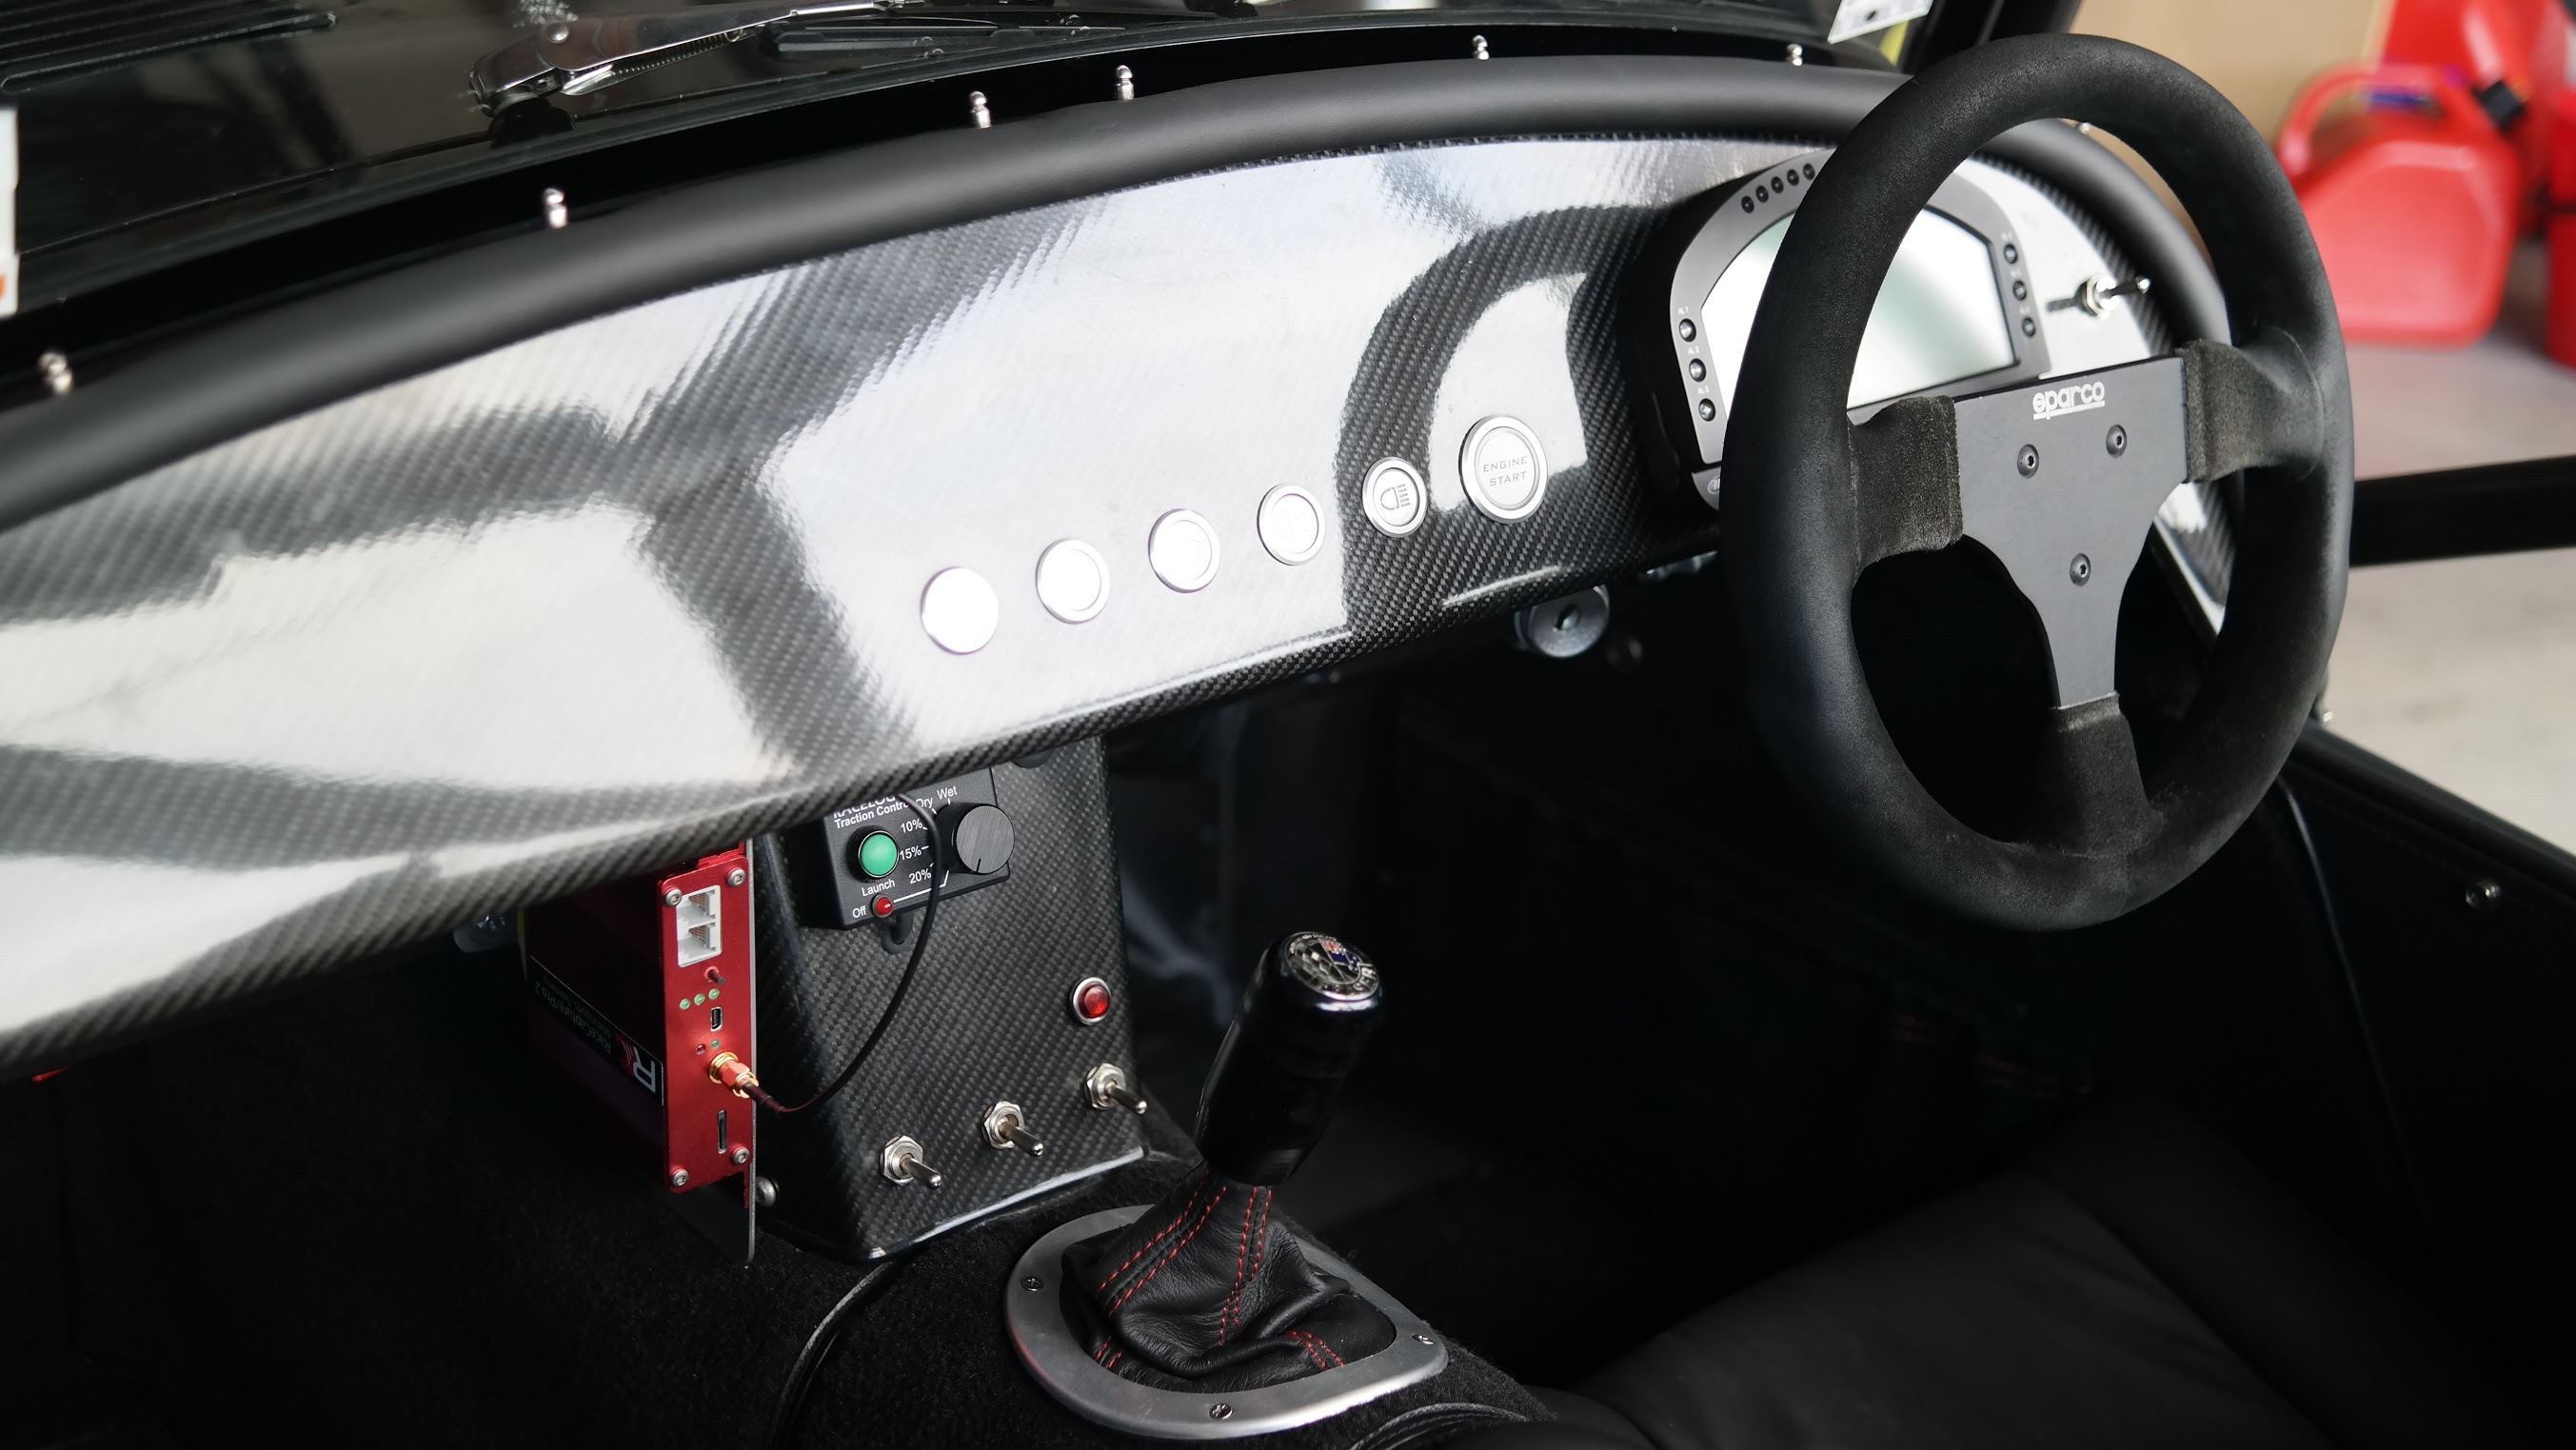
So you need to purchase and install it; now I will say it’s not quite “plug and play”, close but I made a few wrong turns. The documentation/software is still a bit of a work in progress. Autosport Labs make up for in support and have been super helpful getting me up and running. In my case to install the system I needed to do the following
- Put it on a rock solid mounting plate as close as possible to the centre of the car. The unit is super sensitive so it really needs to be as solid as possible.
- Splice into the CAN bus wiring, we used just one connector, wiring CAN H, CAN L, +12v, GND into the RJ45 connector into the back of the unit.
- Open the RaceCapture App on my laptop plugged in via USB to the unit, configure the unit by uploading a “script” that tells it what CAN signals to pull from the ECU (note: this is being improved here https://www.autosportlabs.com/next-generation-can-bus-mapping/)
- Test it out by jumping into the RaceCapture App, fire the car up and see the channels working. To freak yourself right out watch the roll/pitch channels and give your car a good shove- you should see them react instantly.
- Ensure that you’ve selected and written your track(s) you race at to the unit. Note I didn’t do this and found this out later on
At the track
- Make sure you’ve got a SD card in the unit
- After you’ve started the car press the magic data logging button, one of the LED’s on the unit will flicker to let you know all is ok
- Go turn some laps
When you get home take out the SD card and download your RC_x.log files.
At time of writing Autosport Labs had just completed this kickstarter for a plug in play unit based on OBDII port. Worth looking at here
Step 2 – Prepare your data
The file produced can be used for a variety of things, in RaceCapture’s upcoming release of their app you can analyse it, you can also reformat it for export into other programs. In our case we want to make awesome videos to share, to do that we need to take the file and get it into a good format for Dashware.
To get the file ready to import into Dashware, you need to manipulate it. It’s a .log format, which is close to but not quite what we need. Dashware needs a .csv format, and a very key piece of data (a timestamp counting up in seconds) whereas the timestamp column in the log file is absolute time in milliseconds. Being a programmer I wrote a little script to do the leg work for me however you can do the following in Excel.
- Open the log file in Excel, go to Data > Convert Text to Columns > Use comma for the seperator
- Ensure that the 2nd column is of format text, otherwise it’s too large as a number
- For the 2nd column (“Utc”|”ms”|0|0|1), make a new column and subtract the first value in the first entry from every item, divide this by 1000 to get back to seconds
- For all of the headings, take the format of “AccelX”|”G”|-333.0|333.0|25 and change to “AccelX” this is super important as it will lead to no amount of frustration if your column headings change in subsequent data logs
- Get rid of any rows that don’t have a valid latitude and longitude
- Export the resulting file as .CSV
Now you’ve got a file ready to use in Dashware
Step 3 – Combine your files in Dashware
Dashware is a very cool tool that allows you to combine your video footage, along with data, to create the dash overlays – it’s a free download from here. There’s a number of tutorials online about how to use it, to save repeating them I’m just going to hit the key points related to our converted RaceCapture file.
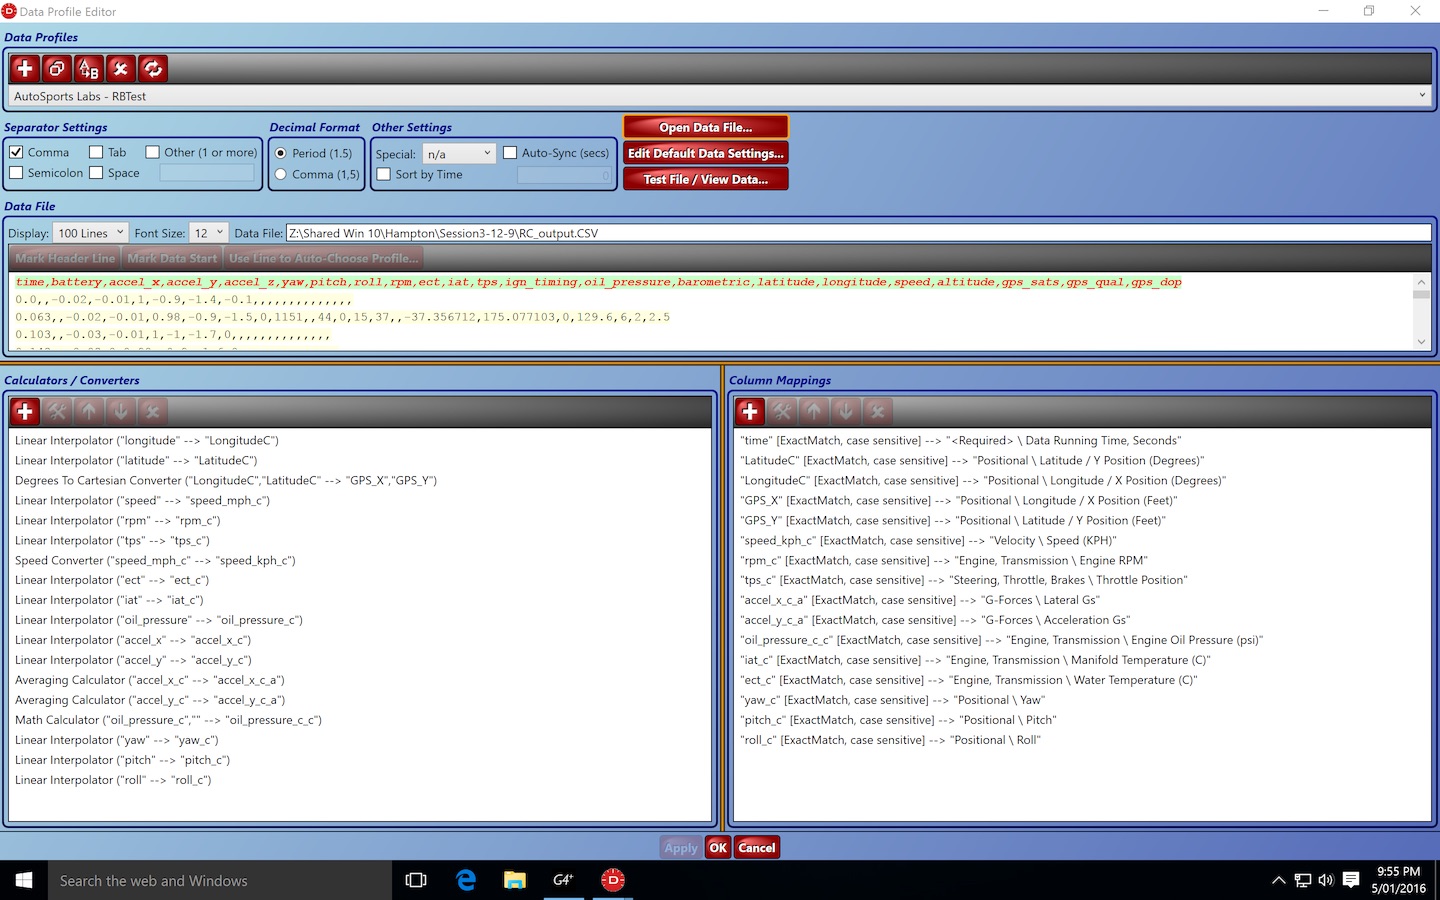
You need to create a data profile that tells Dashware to do the following, based on the data file you created above. Note that the Data Profile for Autosport Labs in Dashware won’t work, you will need to create a custom one.
- Interpolate your data. Ensure your data doesn’t have “holes” in it. I.e. you might log rpm every 10hz, but if you’re logging something else at 20hz, your rpm entry every 2nd line will be blank, you don’t want the RPM gauge flicking back and forth to 0. To do this you use the “Linear Interpolator” and point it at a column eg “RPM”, then give it an output column name eg “RPM_C”. Rinse and repeat for every column that doesn’t have continuous data
- Average your data. Some values will change to rapidly and look terrible in the video, so you can average the values to “smooth” the transition. I chose to average any of the rapidly changing items for display eg TPS, RPM, Accel values
- Add the Cartesian Converter. You need to tell dashware the map coordinates x/y in feet, to do this you need to add a degrees to cartesian converter.
- Map columns Then you need to tell Dashware which columns mean what, critically you need the following to get it working :
- Data Running Time, Seconds
- Latitude, Longitude in Degrees AND feet
Below are the key steps
-
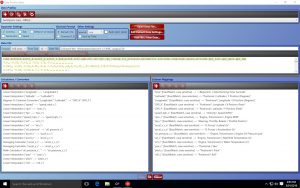
- Correctly setup your data profile
-
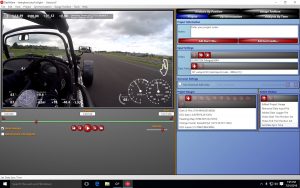
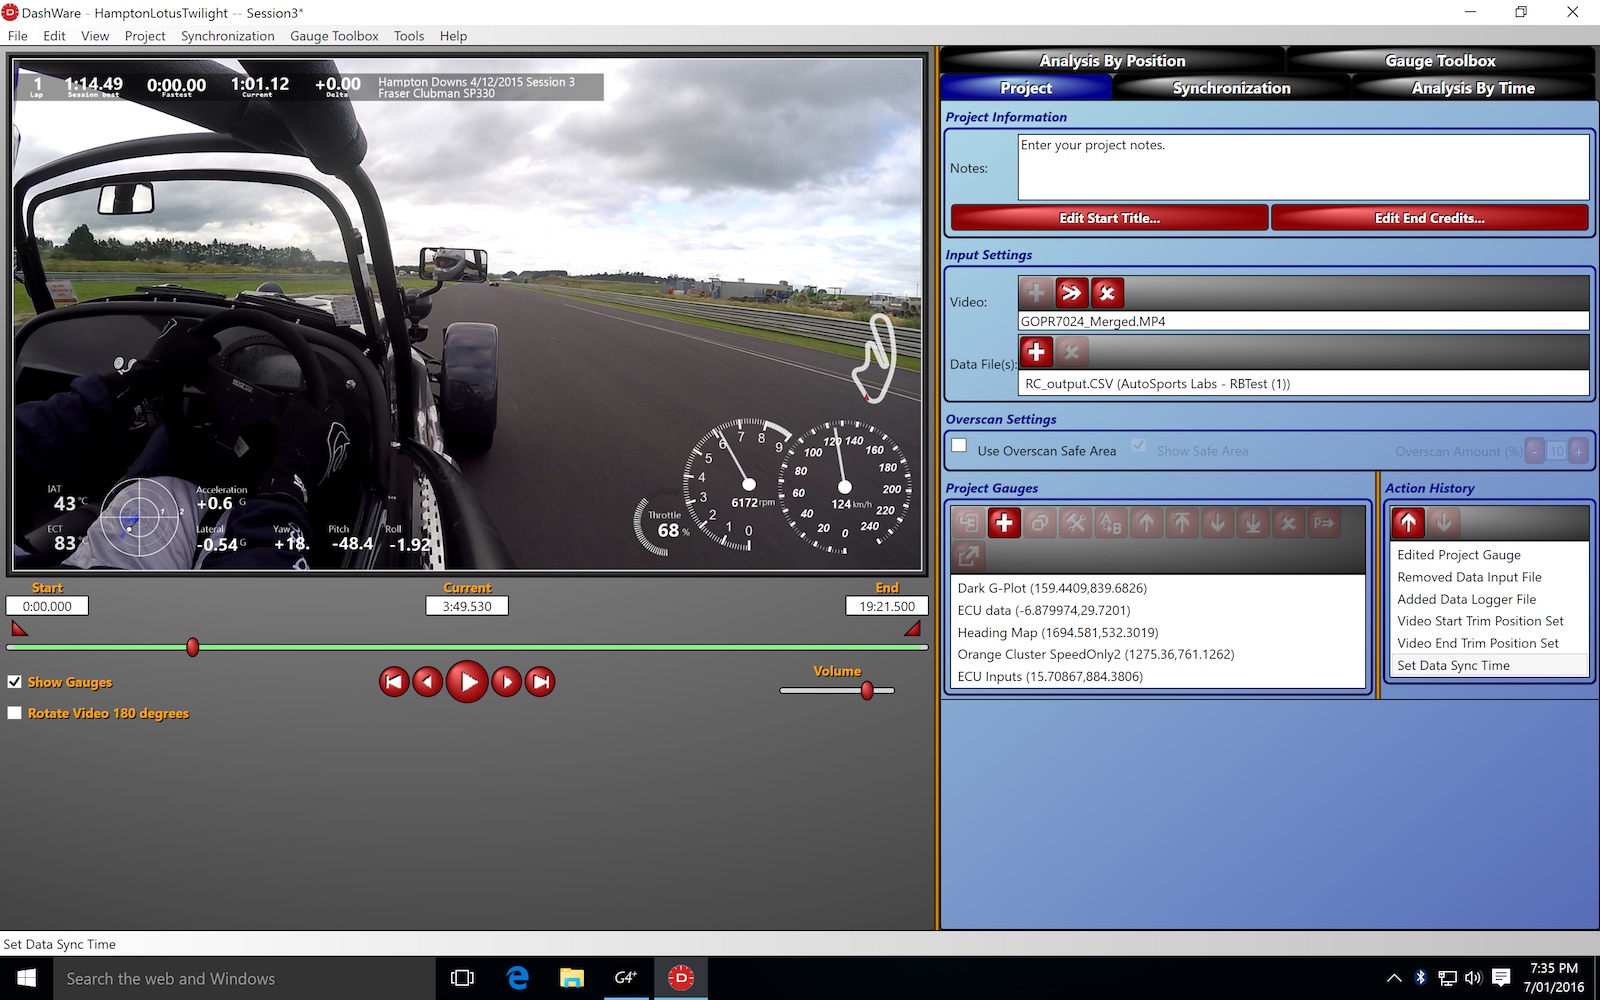
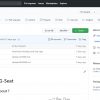
- Add your video file, choose your data profile and pick the csv file (note this screen is after I’ve setup gauges)
-
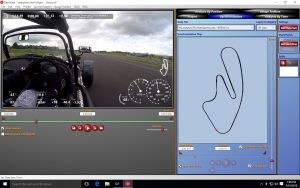
- Next set a start/finish point *and* synchronize your video to the data
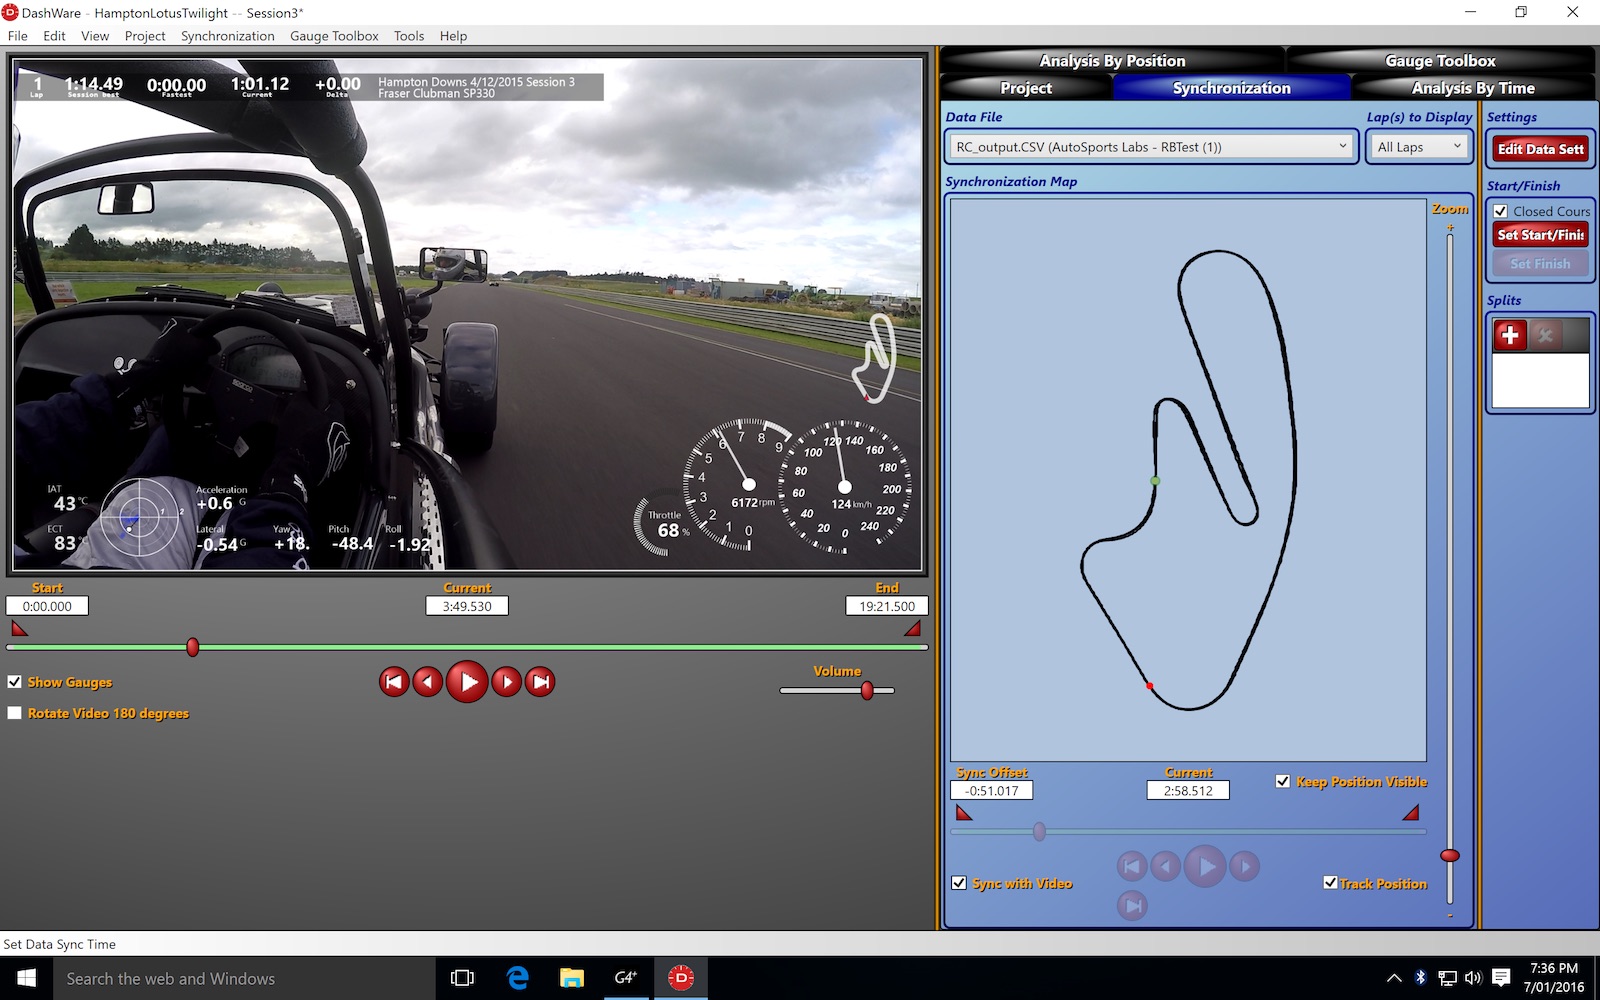
Now you can go nuts adding Gauges, graphics etc to your video. Dashware is particularly cool in this regard as it not only gives you existing templates to use, but you can combine any arcs, rectangles etc and “map” them to your data – giving you the building blocks to build your own gauges. I will say I spent more than a few hours on the ones in my video…
STEP 3 – Share it
Now you’ve got some sweet onboard footage, share it with the world. https://www.youtube.com/results?search_query=onboard

If you already have an MXL (assuming it’s a Pista), why don’t you export from Race Studio 2 to a csv file and import that into Dashware? Lots of people already do that.
Hi Matt – my dash is only the Strada so no datalogging capabilities there…
[…] Data export – you can now export your saved sessions into the RaceCapture log file format – which can be imported right into RaceRender for easy data overlay. Our customers also successfully used Dashware – Rowan Hicks has an excellent blog post on the topic. […]
This is awesome, I just made my first Dashware video with RaceCapture/Track logs, it was awesome. I have a lot of work to do in order to get my gauges looking good, but at least I got them all hooked up. Thank you!